
You’ve been working on your new website for a few weeks or even months, and it’s finally done. Your brand new website is live for the whole world to see. And you are proud as hell! Well done.
But how do you know if your new site is performing well?
- Are visitors finding what they’re looking for?
- Are they doing what you want them to do on your website?
- Are they buying your products?
- Are they filling out your forms?
Your site is shiny and new, but if it doesn’t perform as you hoped, you’ve just spent a whole lot of money on something that isn’t actually moving your business forward. Let’s check out a few free tools you can use to monitor your website’s performance.
Google Analytics
When you publish a new website, the first tool or service you’ll normally want to check out is Google Analytics. You can add this to your website by including a short piece of code on every page of your website. If you don’t know how to do this, you should ask the team who built your website to do it for you, or you can learn how to do it yourself.
With Google Analytics you can gather insights into 4 important aspects:
- Audience: who is visiting your website?
- Acquisition: where are your visitors coming from?
- Behaviour: what are your visitors doing on your website?
- Conversions: are people completing actions on your site?
Google has built these reports to be as simple as possible, but you can customise almost anything so that the reports match your specific situation and display the information that is most relevant to you.
Why should you add this service to your site?
Well here are some of the questions Google Analytics can give answers to:
- How many visitors is my website receiving per month?
- How long are visitors staying on my website?
- What pages are they looking at?
- On what pages are people leaving my site?
You want to get even more insights into the behaviour of your visitors and the performance of your marketing efforts? We’ve got some other great articles for you here:
- 5 musts to improve your digital campaign performance
- Top 3 KPIs online marketers can’t ignore anymore
Hotjar & Fullstory
If you’re more of a visual person rather than an analytical one, these next two tools will be right up your alley. Hotjar and Fullstory are actually very similar tools. They both give you insights through heat maps, conversion funnels and site recordings.
Heat maps
Heat maps are a great way to see exactly how visitors interact with different elements on one or more of your website pages. You can generate heat maps based on how far people scroll through your website, on what buttons or links they click or where they move their mouse.
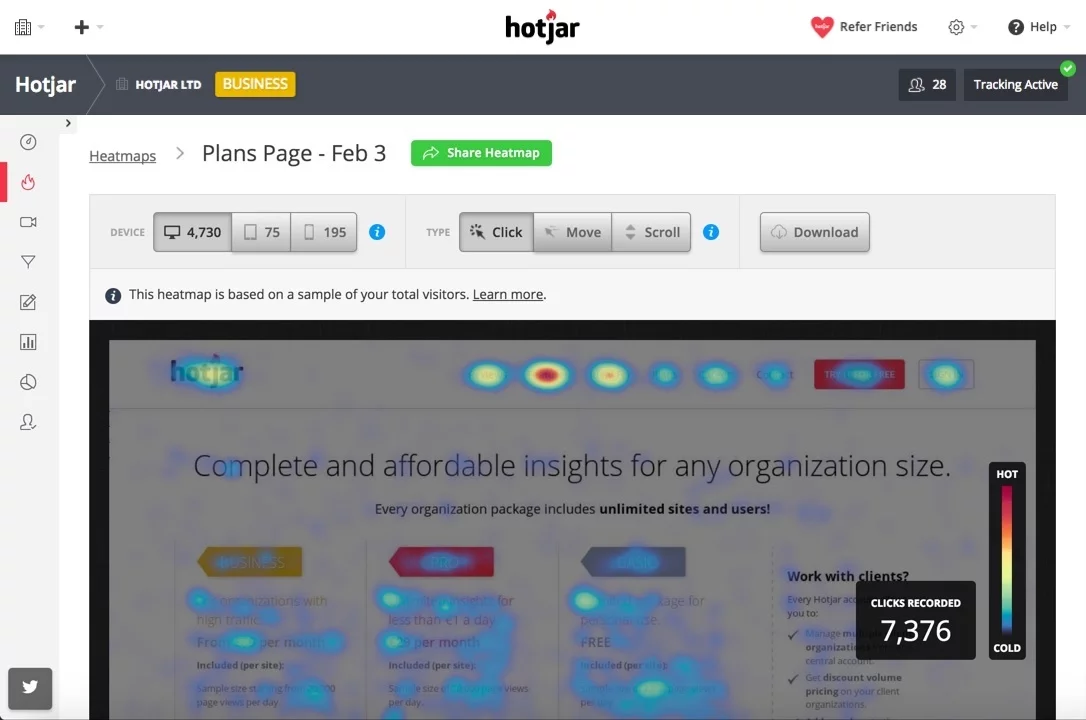 Source: hotjar.com
Conversion funnels
If a visitor has to follow a path with multiple steps in order to complete an action on your website, a conversion funnel is an excellent tool to visualise when and where users abandon this process. This will give you a great insight into where you can optimise the process for your visitors and increase the completion rate.
Personally, I like the way Hotjar visualises the funnel. They manage to give all the relevant information in a clean, simple overview with both absolute numbers and percentages. They also indicate the steps in the process with the highest dropout rate (in red) so you know instantly the places you need to optimise.
So, Hotjar or Fullstory?
As you can read, Hotjar and Fullstory are very similar in the data and insights they offer. Check out their websites for user feedback polls: (Hotjar) or Rage Clicks (Fullstory).
Both Hotjar and Fullstory offer a free plan … it’s a great way of testing them out and seeing if you can learn something useful.
If you’d like to store more data, or save your data for a longer period of time, you’ll need to upgrade to one of the paying options. For smaller websites, with little traffic, Hotjar is the cheaper option. But it’s up to you to decide what features you value more before choosing which tool you’d like to use.
Google Lighthouse
The last tool on our list is a bit different from the tools above. To use Google Lighthouse, you don’t need to add any code to your website. You just have to use the Google Chrome browser to surf to your website.
When you have your website open, navigate to View > Developer > Developer Tools. A new window will pop open with a lot of technical information. Look for the section entitled “Audits”.
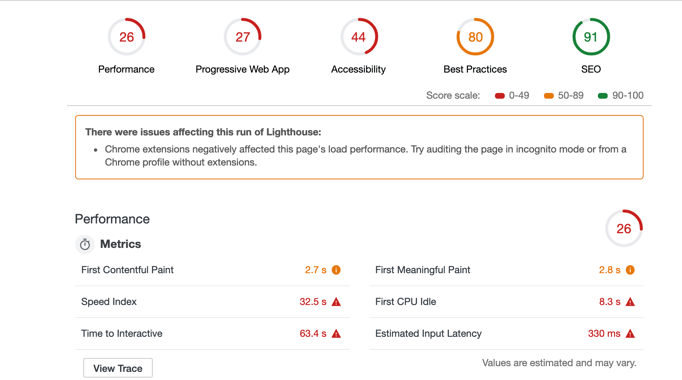
When you click the blue “Run audits” button, Chrome will do some magic to generate a report for your website. After a few minutes, you’ll be able to evaluate your website on 4 interesting aspects:
- Performance: how fast is your website?
- Accessibility: is your website easy to use? Even by people with a disability
- Best practice: is your website respectful of general coding standards?
- SEO: how will your website perform in search engines?
The good news? Google Lighthouse actually gives you insights as to how you can improve your visitors’ experience. In the example above, you can see that we should re-size the images used on the website to decrease the loading time.
If you need more information on how to interpret all the insights Google Lighthouse offers, look at the Lighthouse knowledge center. You’ll be able to learn a lot!
Need some help?
You want help in analysing and optimising your website? Don’t hesitate to reach out.
Written by Jovi Verheyen, User Experience Expert
Filed under INSPIRATION